5 Chapter 5: Sales/Business Plan
Understanding elementary sales planning will help the sales team think through future sales activities. The waterfall chart below gives insight into the ups and downs of managing the customer base.
Organizations build plans upon how the company has performed. Rarely will a firm ever plan for less revenue than the previous year. So, even for the territories that may experience churn (loss customer base), the plan will still be there based on the overall revenue from the previous period measured.
Gap Analysis
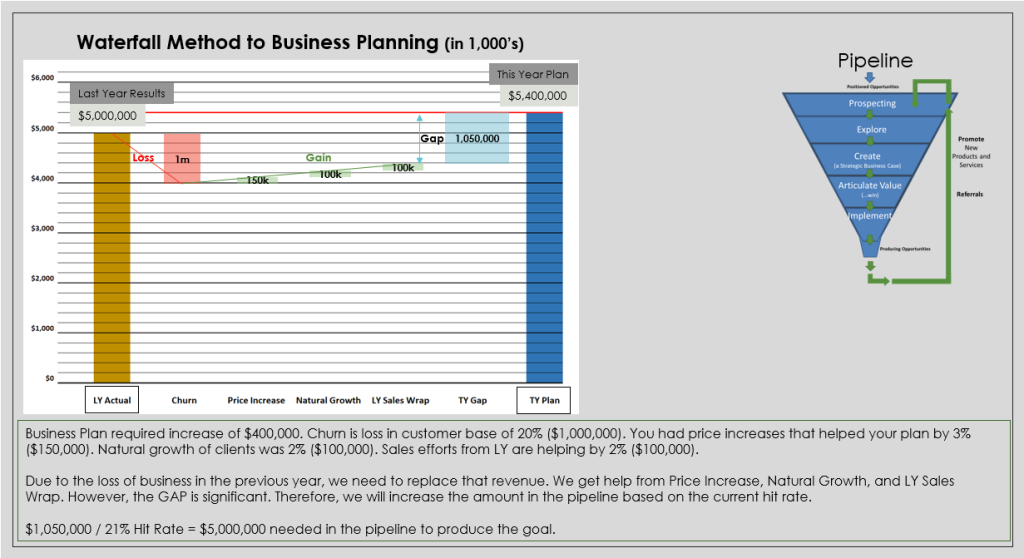
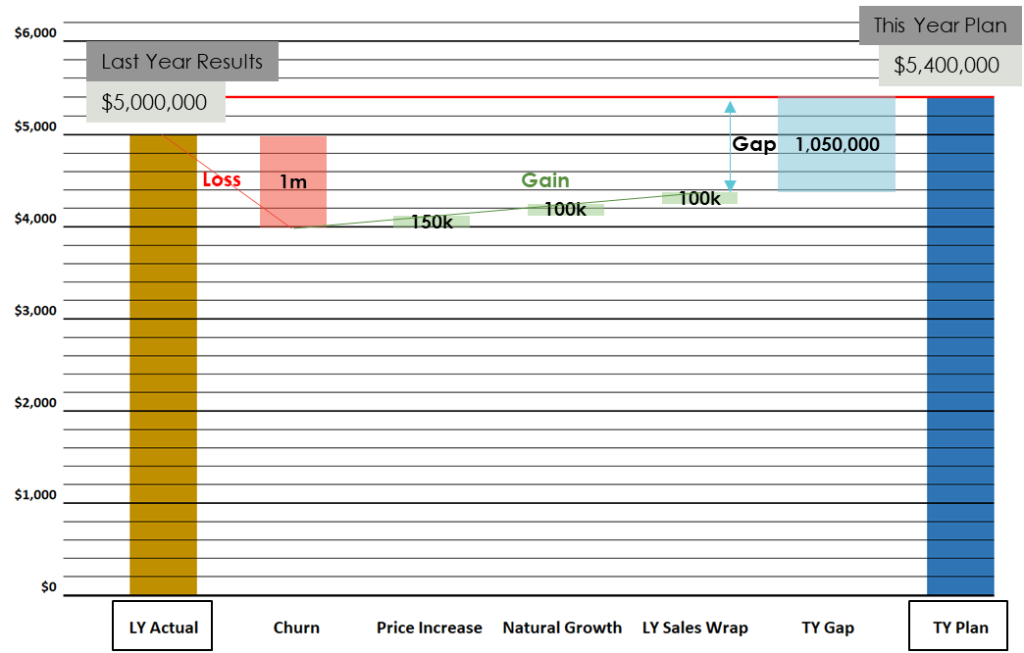
The Sales/Business Plan for the example below requires an increase of $400,000. Churn is loss in customer base of 20% ($1,000,000). There was a price increase that helped the plan by 3% ($150,000). Natural growth of clients was 2% ($100,000). Sales efforts from LY are helping by 2% ($100,000).
As the team works through the numbers of the goal required and all the impacts, both positive and negative, that can affect results, the “gap” reveals the true efforts that the sales team must undergo to achieve the plan.
See the GAP in light blue on the waterfall chart. There is a $1,050,000 new goal that the sales professional must strive to achieve. The sales team is responsible for making up any loss that occurred due to churn.
Commonly, during earnings reporting, the CFO will report the current year’s sales numbers and the expected growth of the firm. Rarely is there an allowance for the sales team to suggest a decrease in revenue expected for the new year.
In the example, the sales team must make up a gap of $1,050,000. Therefore, the team will perform the math based on the hit rate. Due to the loss of business in the previous year, we need to replace that revenue. We get help from Price Increase, Natural Growth, and LY Sales Wrap. However, the “GAP” is significant. Therefore, we will increase the amount in the pipeline based on the current hit rate.
$1,050,000 / 21% Hit Rate = $5,000,000 needed in the pipeline to produce the goal.
Although the task may seem daunting at first math, the team must stay focused with a positive mindset to find the prospects and target new revenues.
When building territory business plans, there will be inclusion of economic factors by territory. For example, in the chart below there is geographical GDP growth data. The GDP data provides insight into the growth of the geographical data overall for the territory. Sale management will consider GDP growth data when preparing sales goals for the next planning period.
Calls per Day/Hour
Part of the responsibility of the sales professional is to ensure there is sales related activity that fills the day of the sales team. Just like with the hit rate when a salesperson is engaged with a viable opportunity, there is an average “calls per day/hour” that is required to achieve the number of viable opportunities to enter the pipeline. The following is an example of common sales organizations:
Josh and Kris need to increase the number of prospects in the pipeline. Burt is a little low in the Build and Articulate phase. Currently the entire team is responsible for making 12 calls per hour to prospect clients to determine if they are viable targets to put in the Prospect phase of the pipeline.
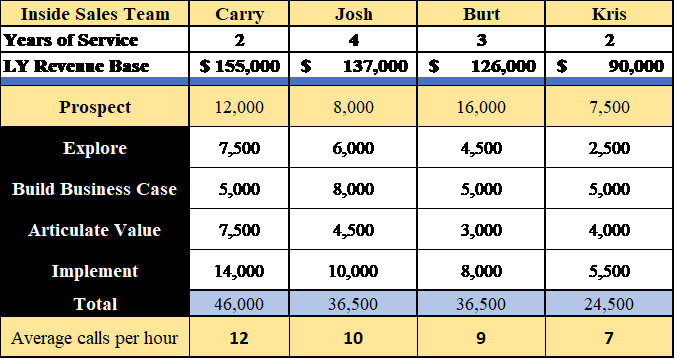
Observation of the report tells us that Carry is attempting 12 calls per hour. As a result, she is trending with the most opportunities that are new to the pipeline in the Prospect phase. The other three are not fulfilling their obligation to the team and therefore must be addressed to determine reasons for poor performance.
Making the Sales/Business Plan
When determining an appropriate sales plan, there are key components. One very important piece of the plan is historical data. Sometimes the data is segmented into geographical areas and/or industry segments (healthcare, manufacturing, etc.).
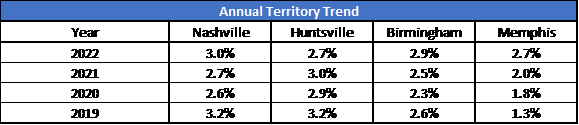
For example, in the chart below there are four key markets within the southern Atlantic region of the U.S. Notice the growth trends for the territories. These trends should hold weight for the algorithm used in the planning process.
The performance report of the individual (by territory) will give a good understanding of the current sales situation and the results of the team. Take note of the phases of the sales process. Note the wins from LY from each sales professional. The hit rate and the GDP gives insight into the success of the sales professional compared to the market trends.
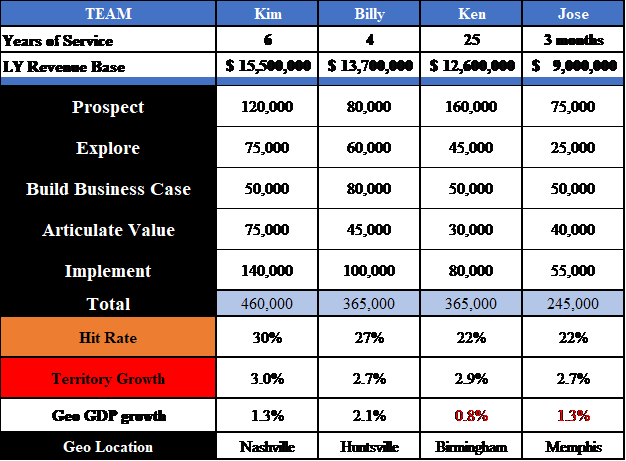
Based on all the data – previous four years results, current sales pipeline, years of experience, hit rates, GDP data, and current economic outlook, what might the sales/business plan be for the next sales reporting period?
Growth should be the elementary thought. Growth is a given unless there is a real economic or supply chain issue. The management may consider that for Nashville (Kim’s area), we can say the following:
- GDP is the highest in the region with 1.3%.
- Territory growth on average for the previous four years is close to 3.0%.
- Kim has six years of experience.
- The results of the territory LY are the highest in the region.
- The Pipeline is somewhat healthy and balanced.
- Hit Rate for Kim is the highest in the region. This speaks to her ability and possibly the quality of leads that she is receiving from the marketing team.
Based on the data, the manager can comfortably plan for a 3.25% increase in the new sales period if there are no other issues of impending serious economic recession or supply chain disruption.
Memphis (Jose’s area) has a different story to tell. Some of the observations are as follows:
- GDP is trending negatively at -1.3%.
- Territory growth is increasing over the four-year measurement period.
- Jose is new in the territory (this is a red flag for planning – someone less than 18 months in the sales job).
- Sales results LY is lower than the rest of the team.
- The Pipeline compared to the other territories are lower.
- Hit Rate for Jose is low compared to the average. It is expected due to being new in the role.
Based on the data for Memphis, this territory may not be able to receive a planned increase as Nashville. The plan will most likely be somewhere around 2.5% as some of the sales results for the territory was the predecessor to Jose.
It is important to note that the sales plan should be using the data. Consider all the elements that may affect the performance of the territory. Give some grace to the employees within the 18-month training period. Be transparent with the process and the data. Transparency and open communication can prevent future disruption among the team due to perceived issues with the planning process.
Chapter Overview – YouTube channel
