4 Chapter 4: Sales Metrics
Hit Rate is a common term used to determine a percentage of wins versus attempts. Hit rate measures the effectiveness of the sales team (member) sales efforts related to the number of prospects approached. A higher-than-average hit rate suggests the following:
- Prospecting leads are from an effective source or process.
- The ability of the sales team is typically more effective.
- Market conditions favor the team.
The hit rate is important because it is a foundational element to understanding the science of sales. Sales-math is a term used to describe the analysis (including a “gap” analysis) used to help the sales team understand the urgency and critical nature of having a good process for prospecting. Consider the following, how do you know how many prospects are enough to target to make the sales plan? The sales team must be prepared to target a market based on the number of attempts on average it takes to make a sell. See the example.
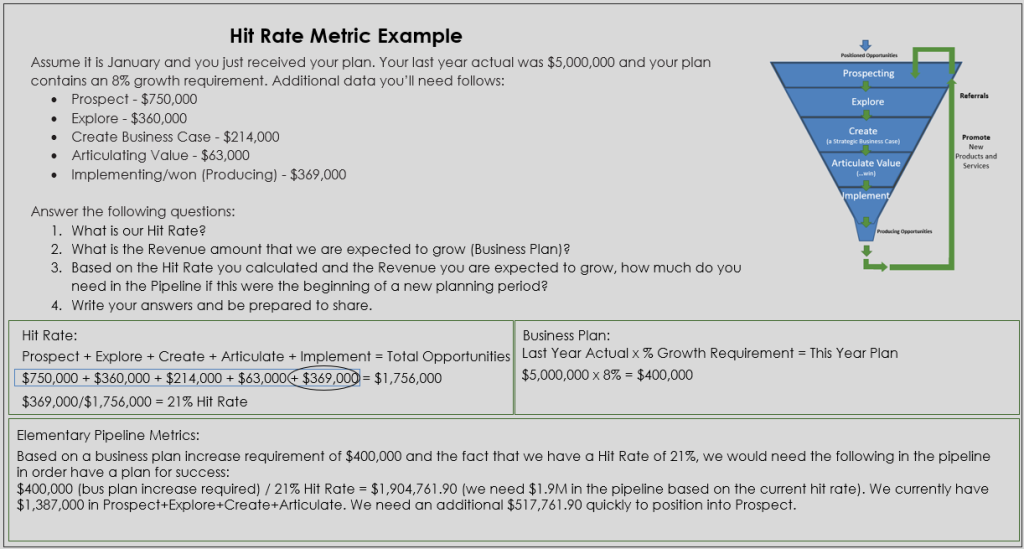
Assume it is January and you just received your sales plan. Your last year’s actual was $5,000,000 and your sales plan contains an 8% growth requirement. Additional data needed follows:
- Prospect – $750,000
- Explore – $360,000
- Create Business Case – $214,000
- Articulating Value – $63,000
- Implementing/won (Producing) – $369,000
Answer the following questions:
- What is Hit Rate?
Prospect + Explore + Create + Articulate + Implement = Total Opportunities
$750,000 + $360,000 + $214,000 + $63,000 + $369,000 = $1,756,000
$369,000/$1,756,000 = 21% Hit Rate
- What is the Revenue amount that the team is expected to grow (Sales Plan)?
Last Year Actual x % Growth Requirement = This Year Plan
$5,000,000 x 8% = $400,000 growth plan over last year. Add the growth plan to last year’s (LY) revenue and that gives us this year’s (TY) sales plan of $5,400,000.
- Based on the Hit Rate you calculated and the Revenue you are expected to grow, how much do you need in the Pipeline if this were the beginning of a new planning period?
Based on a business plan increase requirement of $400,000 and the fact that we have a Hit Rate of 21%, the team would need the following in the pipeline to have a plan for success:
$400,000 (bus plan increase required) / 21% Hit Rate = $1,904,761.90
The sales professional needs $1.9M in the pipeline based on the current hit rate. Currently there is $1,387,000 in Prospect+Explore+Create+Articulate. An additional $517,761.90 quickly to position into Prospect.
As an elementary view into sales planning, this process gives insight into a sales professional’s need to prospect effectively. High quality prospects will yield a better hit rate and therefore less prospects are needed to win.
Sales Metric Definitions
Sales Plan: Sales plan is the growth metric over the previous year or quarter that suggests a standard of achievement required by the team. Usually, the sales plan is expressed as a percentage required growth over last year. For example: Last Year (LY) we sold $1,000,000. We have a plan increase of 10%. So, this year our plan is $1,100,000 (LY + This Year’s required increase).
Churn: The reduction in revenue due to lost customers.
Closed: No deal is better than a bad deal. If a deal cannot be made with the client, the opportunity is removed from the pipeline and put into a closed/lost repository for review with the marketing and sales management team. It is important to do a postmortem examination of why the sales efforts were not successful. In many cases trends can demonstrate competitive disadvantages within a territory or with a certain product or service.
Hit Rate: Hit rate is represented in a percent format. It is calculated dividing the total producing opportunities in the last 12 rolling months by the sum of all active positioned opportunities. It is intended to demonstrate the average percentage of all positioned opportunities which have historically moved to Implementation for a given business unit or salesperson. The number is represented as a percentage of opportunities and a percentage of revenue.
# Opportunities per Phase: This is the total number of potential clients currently in a particular phase of the Pipeline. The sales professional must drill down into the Pipeline to determine how many actual accounts are being targeted. The number of opportunities within the phases are an important metric for future success. There should be continuous movement of opportunities through the pipeline phases driven by the efforts of the sales professional.
Velocity: Velocity is a measurement of the average time in Business Days it has taken for all producing opportunities in the last 12 rolling months to move from Prospect to Implementation. This is calculated by taking the sum of business days from Prospect to Implementation for all producing opportunities in the last 12 rolling months and dividing by the total number of producing opportunities in the last 12 rolling months.
Customer Resource Management (CRM) tools provide all of the sales metrics within an easy to use platform that includes dashboards for easy analysis. Using internet search engines to view the latest tools by Salesforce, Microsoft Dynamics, Oracle’s NetSuite are great examples of what is possible for sales teams.
Chapter Overview – YouTube channel
