7 Chapter 7 – Does the Process Work?

The research study underpinning the S4 standards used a mixed methods approach the included both quantitative and qualitative research elements as well as an adapted quasi-experimental framework (Figure 7.1). In the first part, the methodology included both pre and post-test surveys, conducted on line (via Survey Monkey ®), and in person as necessary, to test the two primary research hypotheses. To better understand the impact of the S4 assessment process on the schools’ safety and security environments, the researchers also conducted observations of school processes as well as a qualitative external school safety and security assessments utilizing the S4 standards and included checklists (Chapter 9). These activities also included the collection of qualitative input from the principals/directors (and selected faculty and staff) of the participating schools.
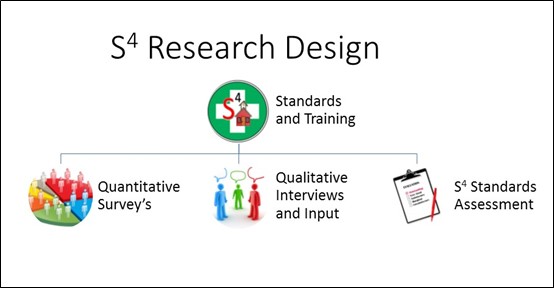
Figure 7.1 – S4 Research Design
Additionally, selected schools (the desire was to have at least 1/3) were encouraged to conduct either table-top simulation or a full profile school safety and security exercise as part of their S4 process to help determine the impact of such an experiential learning opportunity.
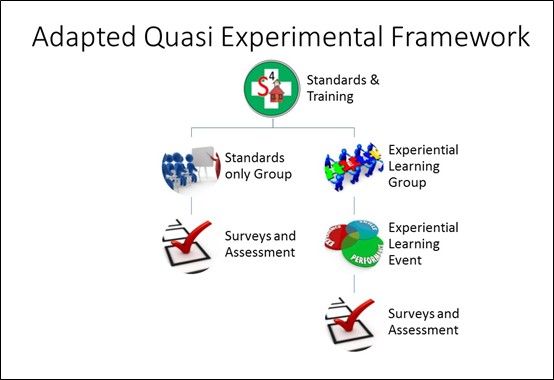
Figure 7.2 – S4 Quasi Experiment Framework
The basic requirements for participants in the study was to take the initial survey, attend or view the (S4) standards training, receive a copy of the standards and checklists, and take the follow-up survey. Participants were also encouraged (but not required) to use the standards and checklists in a self-assessment of their classrooms and work areas within the school. As mentioned, selected participants participated in an experiential learning activity (full profile school safety and security exercise or interactive video) as determined by their school administration.
Interviews with the participants were conducted as part of the external school safety and security assessment and consisted of individual interactions largely related to asking questions to determine compliance with the standards. This is fairly standard practice in conducting security assessments and safety inspections. For instance, asking someone about their knowledge of, or to explain how a particular school policy is implemented. These took place at the school, and usually were no longer than 5-10 minutes of conversation. Research observations made were related to compliance with the School Safety and Security Standards and the included checklists. Observations were primarily used in determining if the school complied with the S4 standards or if improvement was needed in certain areas. The same was true of the checklists included with the standards.
Because of the constraints of having to work within existing school system organization and structure, it was not possible to randomly assign participants in order to be able to conduct a true experimental research framework. However, with the variation of participating schools, and school systems and the willingness of two of the participating schools to conduct experiential training activities, the ability to use an adapted quasi-experimental research framework was achieved. The initial research population used consisted of eleven schools at all grade levels from both public and non-public systems in North Alabama, and one school in North Central Georgia. Out of the eleven schools that were initially involved in the research, six of them completed the entire evaluation process to include the external safety and security assessments using the S4 standards and those six schools were included in the sample for the final data analysis and results.
There were 151 total participants who completed the initial pre-test survey and began the project, with 79% being teachers or faculty members and the remainder being a mix of staff and administrative personnel. All grade and experience levels were represented among the participant population. Of that initial population, 92 of the original participants completed the self-assessment utilizing the S4 standards and also finished the final post-test survey to complete the process. This yielded a response and completion rate of 60.9%, which was determined to be a sufficient and valid sample size for the research.
Data Analysis and Procedures
All data collected in the form of surveys was kept strictly anonymous. Individual school observations and assessment data were only shared with that school’s administrator and specific results were aggregated so as not to disclose specific school locations within presentations and publications. The promise made to the school administrators was that individual findings or areas of improvement found related to their facility will only be shared specifically with them. Any other discussions of weaknesses were to be aggregated and discussed in general terms in the findings so as not to indicate a specific weakness at a specific school – for obvious reasons. School results were coded using numbers versus names and locations.
Because of the nominal and ordinal nature of the quantitative data collected on the pre/posttest survey instruments, it was determined that the data analysis functions within the Survey Monkey® platform combined with exporting selected question data to the IBM SPSS ® Statistics Package (Version 24) was the best approach to conducting the quantitative data analysis. The primary vehicle to test the hypotheses of this research consisted of Likert type responses to questions related to the participants’ perceived level of knowledge and confidence (the dependent variables) regarding school safety and security.
To allow for statistically valid comparison, these Likert type response categories were converted by weighting each of the response categories with values from one to five, on both the pre and post- test comparison questions. A pairwise comparison was then completed using Cross Tabulation and the Chi Squared statistical process to compare participant responses between the pre and post-test surveys to determine statistical significance. From there, the change of response percentages across categories was compared from pre to post-test to determine the impact of the S4 process on the dependent variables of ‘knowledge’ and ‘confidence’ in relation to school safety and security.
In regard to the qualitative data that was collected during both the S4 self-assessments and external assessments, as well as data collected during the qualitative interviews, the author determined that the use of in vivo coding that emerged from the evaluator and participant’s own observations and comments (such as is done in a Grounded Theory approach) were preferable to pre-determined in vitro coding. This coding method ensured that an emic research perspective was maintained during the data analysis research process (Elliot and Higgins, 2012). Both the qualitative tools embedded within Survey Monkey® and the NVivo® software suite (version 11) were used for qualitative data analysis.
The first component of the qualitative data analysis conducted was the use of both ‘Word Cloud’ and ‘Word Frequency’ analysis processes being conducted on the two open ended questions and responses within the pre and post-test surveys. This provided a window into the top concerns of the participants as well as the variety of issues related to school safety and security. Using that same data set of participant responses, the next process for qualitative analysis involved the use of the advanced qualitative research software program, NVivo® to exam and analyze the unique participant responses. These responses were then coded using an ‘in vivo’ process and fifteen distinct nodes or categories emerged related to school safety and security.
The next component of qualitative analysis involved the more intangible, and emotional responses and impressions of the participants as to the project’s impact. This was conducted using the responses to the final open-ended question asked in the post-test survey as well as responses during the S4 standards assessments and interviews. A sentiment analysis of these results was conducted using NVivo ® to show the positive and negative aspects of the impact of the S4 process.
The final evaluative component of the S4 research project was the actual School Safety and Security Assessment utilizing the previously discussed S4 standards. There were two components to this evaluative process, the self-assessment, and the external evaluation of each school. The results of these evaluations were collected and analyzed to determine overall trends and areas of improvement and also to provide feedback to each schools’ administration regarding their school safety and security posture.
Research Findings and Results
As stated previously, this research project was designed with a mixed method, adapted quasi-experimental approach based on the tenets of Experiential and Mindful Learning to determine the impact and efficacy of voluntary school safety and security standards in the pre-kindergarten through 12th grade educational environment. As mentioned, the final research population used consisted of the six schools at all grade levels from both public and non-public systems in North Alabama, and one school in North Central Georgia. There were 151 total participants who completed the initial pre-test survey and 92 participants that completed the self-assessment and also finished the final post-test survey to complete the process for a 60.9% completion rate, which was determined to be sufficient and valid for the research.
Two of the six schools in the final population had an experiential learning event as an additional part of their research process, with one conducting a full profile school emergency exercise and the other produced an interactive video using faculty and students as part of the participants’ training and evaluation experience. Both of these experiential learning opportunities where related to active shooter response, based on the stated priority and desires of the individual school administrations.
Research Outcome – Quantitative
Considering that the overall purpose of the S4 project was to look at the impact and efficacy of a voluntary set of school safety and security standards, the result was that there were two main research questions that were explored in the project with a corresponding hypothesis and null hypothesis for each.
The first research question explored was R1. Will experience with the implementation of voluntary school safety and security standards enhance the knowledge, skills, ability, and confidence of K-12 school faculty, staff, and administrators that are exposed to and use them in their schools? The corresponding hypotheses for this question are:
H1. School faculty, staff, and administrators who are exposed to and implement voluntary school safety and security standards will have an increased level of knowledge related to overall school safety and security and their school environment will be safer and more secure as a result.
H2. School faculty, staff, and administrators who are exposed to and implement voluntary school safety and security standards will have an increased level of confidence related to overall school safety and security and their school environment will be safer and more secure as a result.
Based on the analysis and comparison of the data from the initial pre-test and final post-test surveys, it has been determined that the null hypotheses for research question one can be rejected based on the observed increases in both the knowledge and confidence level of participants who fully completed the S4 research process and can be seen below in figures 7.3 and 7.4 below.
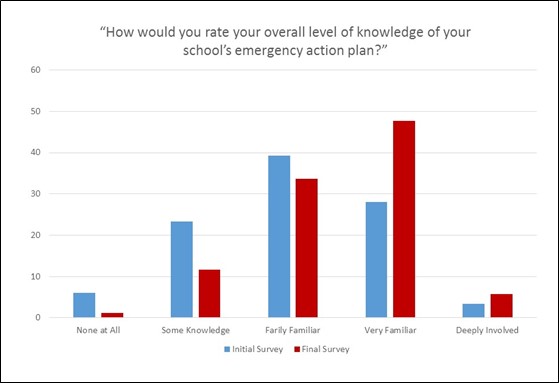
Figure 7.3 – H1 Knowledge Level
In figure 7.3 above, the results of pre and post-test responses to the question “How would you rate your overall level of knowledge of your school’s emergency action plan?” are compared. Based on the results of the Chi-Square (χ 2) cross tabulation (Table 4.1 below), the variable of ‘knowledge’ was seen to be dependent and was determined to be statistically significant (χ 2 = 15.879, df = 4, p<.01) so the null hypothesis can be rejected in this case. The results showed decreases in the categories of “None at all” (- 4.84%), “Some knowledge” (- 11.7%), and “Fairly familiar” (- 5.61%). There was a corresponding increase in the categories of “Very Familiar” (+19.67%), and “Deeply Involved” (+2.48%) for a total positive change of 22.15% in these higher knowledge related categories.
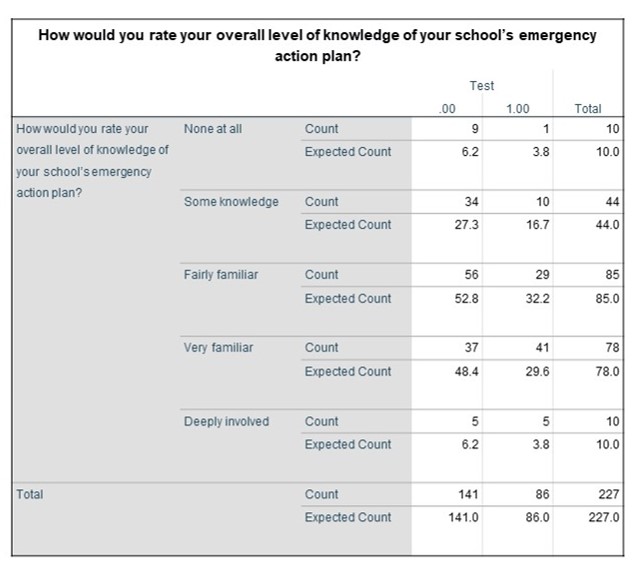
Table 7.1 – H1 Knowledge Cross Tabulation
The second component examined was related to hypothesis two regarding the confidence level that participants exhibited related to school safety and security and their perceived ability to handle an emergency situation at their school both before and after going through the S4 process. The question asked of the participants on both the pre and post-test survey was, “How confident are you in your ability to handle an emergency situation at your school?” The results from this comparison are depicted in figure 4.2 below.
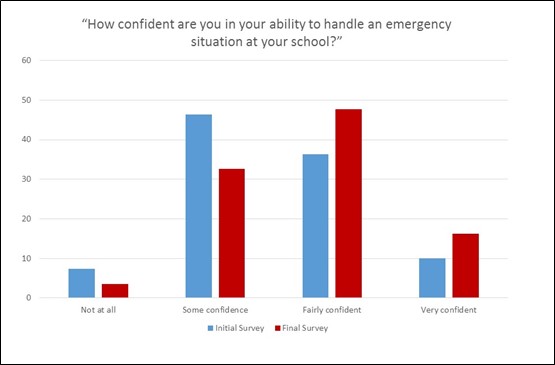
Figure 7.4 – H2 Confidence Level
The results for this question showed similar outcomes, with decreases in the categories of “None at all” (- 3.89%), and “Some confidence” (- 13.75%). As seen with the previous knowledge component, there was a corresponding increase in the categories of “Fairly confident” (+11.43%), and “Very confident” (+6.21%) for a total positive change of 17.64% in these higher confidence related categories. However, based on the results of the Chi-Square (χ 2) analysis, it could not be determined that the results for “confidence’ were completely dependent on the S4 process. As seen in the results of Table 7.4, ‘confidence’ was determined not to be statistically significant (χ 2 = 7.534, df = 3, p>.01), so the null hypothesis cannot be rejected in this case.
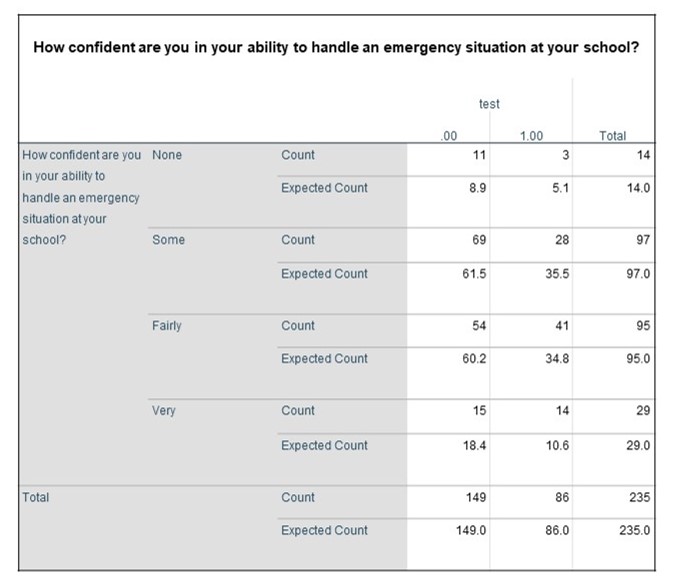
Table 7.2 – H2 Confidence Cross Tabulation
However, when asked specifically about the impact of their experience going through the S4 project research process and the use of the S4 standards on their level of confidence in handling an in school emergency situation, 72% of the participants reported that their confidence increased, while none of the participants reported that it decreased – the remaining 28% reported that their confidence level remained essentially the same.
Closely related to the individual level of knowledge and confidence of the individual participants, was the participants’ impression of the impact that the overall research project and the S4 standards in particular had on the level of school safety and security preparedness within their school. The impact of the participants’ experience in completing the S4 project proved to be significant in this area as well with 62.79% of the participants stating that their schools’ crisis and emergency plans were more complete at the conclusion of the project compared to where they were at the beginning. Additionally, when asked about how participation in the S4 project affected the overall attention to school safety and security within their school environment (figure 4.3), 82.35% reported that there was a positive increase in the attention level, while 17.65% felt that the attention level remained the same (n=85, SEM 4.13%). No participants reported a decrease.
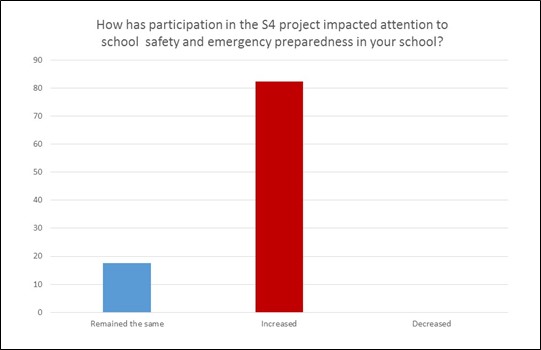
Figure 7.5 – Attention Level
The second research question investigated was R2. What impact does the conduct of a full-profile school based emergency exercise (active shooter, bomb threat, etc.), or a table-top simulation exercise as a focusing event have on the knowledge and confidence level of K-12 school faculty, staff, and administrators that are participants versus those who do not have that experience? The corresponding hypotheses for this research question are as follows:
H3. School faculty, staff, and administrators who are participants in a full profile school based emergency exercise (active shooter, bomb threat, etc.) and those that participate in a table-top simulation exercise will have a greater increase in their level of knowledge related to overall school safety and security versus those that simply experience and implement the standards.
H4. School faculty, staff, and administrators who are participants in a full profile school based emergency exercise (active shooter, bomb threat, etc.) and those that participate in a table-top simulation exercise will have a greater increase in their level of confidence related to overall school safety and security versus those that simply experience and implement the standards.
Originally, the desired intent of the Primary Investigator (PI)/Author was to be able to conduct either a full profile or table top exercise related to an area of school safety in approximately one third to half of the schools examined during the project. It became clear early in the implementation of the research design that this desired outcome was untenable based on the time constraints within the K-12 school environment. Simply put, there is very little time in the K-12 school calendar that can be dedicated to the type of school safety and security exercise regime that was envisioned. In fact, just being able to complete the initial familiarization training, pre/post-test surveys, and self/external S4 assessments proved to be extremely challenging and is the main factor for the attrition of five of the original eleven schools.
As a result, only two of the schools examined where able to include an experiential learning component. As mentioned previously, one school was able to conduct a full profile active shooter exercise which utilized trained undergraduate and graduate student researchers as role players and facilitators to assist the faculty and staff and responding law enforcement personnel in exercising the school’s active shooter plan. A second school chose to produce an interactive video utilizing their film study resources and their faculty and staff to demonstrate the school’s active shooter protocols. While not optimum, this still allowed for the observation of the quasi-experimental framework with two thirds of the participant schools serving as the control or ‘standards only’ group and one third of the schools in the role of the treatment or ‘standards and experiential’ group that had an experiential learning experience as part of the S4 process.
As was seen in the evaluation of the results regarding the first research question and hypotheses above, it is clear that participation in the project and the use of the standards had a positive impact both individually and collectively for the majority of the participants involved in the project. However, the second research question and hypotheses sought to determine if the added experiential component of the project would have an increased positive impact on the selected participants which is suggested by both the Experiential and Mindful Learning theory frameworks underpinning the S4 project research design. In an effort to determine this impact, the participants’ responses were analyzed relative to whether they were part of the ‘standards only’ or the ‘standards and experiential’ group in regards to the two previously discussed component areas of knowledge and confidence related to school safety and security. In figure 7.6 (see below), the results are separated into ‘standards only’ or ‘standards and experiential’ groupings for pre and post-test responses to the question “How would you rate your overall level of knowledge of your school’s emergency action plan?”
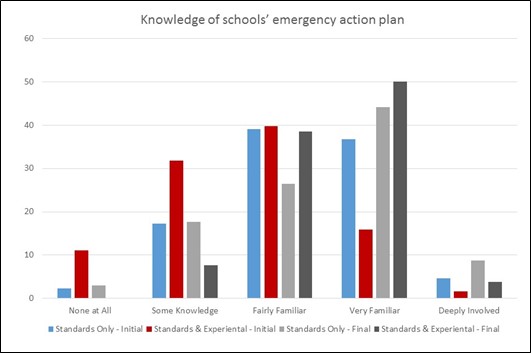
Figure 7.6 – H3 Knowledge Level
As the data above shows, the ‘Standards Only’ group saw virtually no improvement in the ‘None at All’ and ‘Some Knowledge’ categories (actually a slight combined increase of .96%) and improvements in the ‘Fairly Familiar’ category (reduction of 12.61%), offset with positive increases in the ‘Very Familiar’ (+7.34%) and the ‘Deeply Involved’ (+4.22%). As seen in the results of Table 4.3 (below), ‘knowledge’ in relation to the “Standards Only’ group could not be determined to be statistically significant (χ 2 = 2.230, df = 4, p>.01).
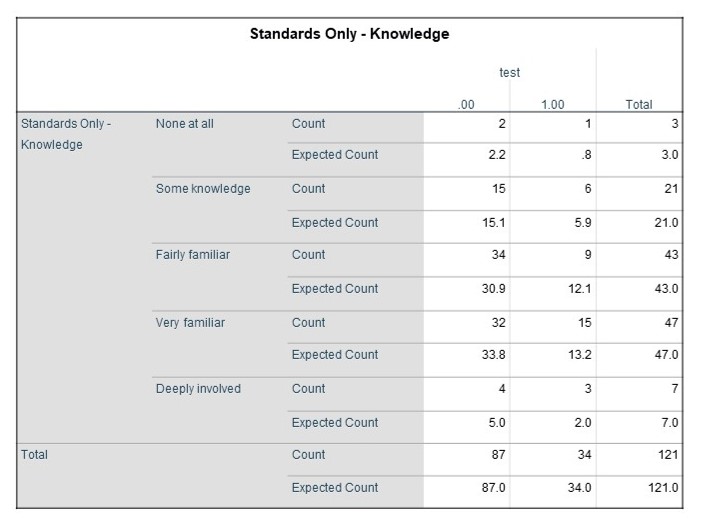
Table 7.3 – H3 Standards Only – Knowledge Cross Tabulation
Comparatively however, the ‘Standards & Experiential’ group results were found to be statistically significant at the .001 level as outlined in Table 7.4 (see below), in relation to the change observed in ‘knowledge’ results, (χ 2 = 24.842, df = 4, p<.01), with a p-value of .000. This group saw an overall 12% greater improvement across all categories with the elimination of responses in the ‘None at All’ category and a significant reduction in the ‘Some Knowledge’ (- 24.06%) and a slight reduction in the ‘Fairly Familiar’ (- 1.22%) category. This was offset by significant improvement, which reached a combined majority of 52.26% of the ‘Standards & Experiential’ group participants residing in the ‘Very Familiar’ (+ 34.13%) and ‘Deeply Involved’ (+2.26) categories. So clearly in the area of perceived knowledge level, the impact of an experiential learning event proved to be fairly significant and allowed the null hypothesis to be rejected for this group.
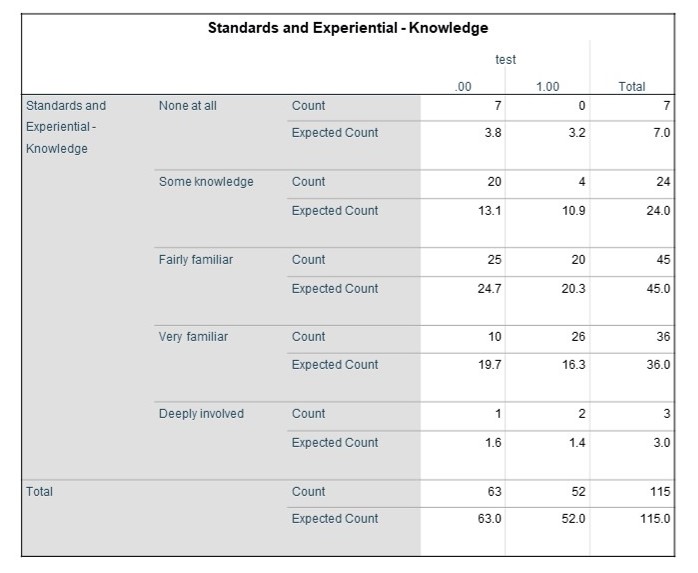
Table 7.4 – H3 Standards & Experiential – Knowledge Cross Tabulation
In looking at the data related to the changes in confidence level between the two groups, the results proved to be significantly less dramatic with only a slightly less than 2% differential in the level of improvement related to confidence between the two groups as is indicated below in figure 7.7 (see below).
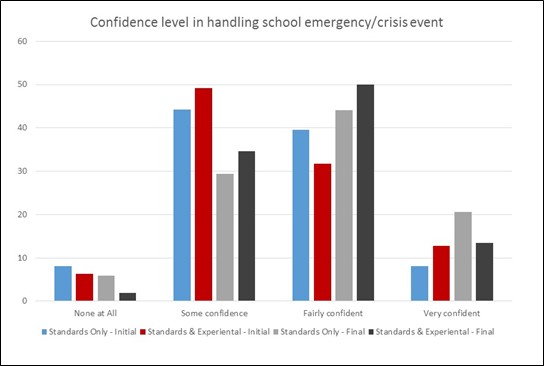
Figure 7.7 – Confidence Level
Looking at the above displayed data, the ‘Standards Only’ group did show improvement in all areas with reductions in the ‘None at All’ (- 2.26%), and ‘Some confidence’ (- 14.78%) categories with a corresponding increase in the ‘Fairly confident’ (+4.59%), and ‘Very confident’ (+12.45%) categories for a total improvement of 17.09% from the pre-test to the post-test. By comparison, the ‘Standards & Experiential’ group saw improvements as well with reductions in the ‘None at All’ (- 4.43%) and ‘Some confidence’ (- 14.59%) categories. Correspondingly, there was a fairly significant increase in the ‘Fairly confident’ (+18.25%) category, and only a slight increase in the ‘Very confident’ (+ .76%) category for a total improvement of 19.01% from the pre-test to the post-test.
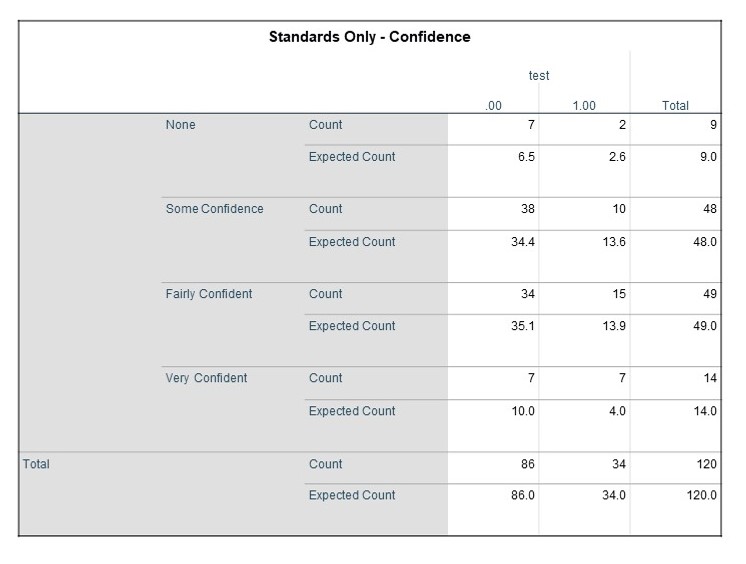
Table 7.5 – H4 Standards Only – Confidence Cross Tabulation
While still greater in terms of improvement with the ‘Standards & Experiential’ group, the positive effect related to confidence level is significantly less than was originally anticipated or expected and is significantly less than was seen with the component of knowledge outlined above. This result was also determined not to be statistically significant for either group based on the χ 2 analysis considering ‘Standards Only’ (χ 2 = 4.857, df = 3, p>.01), with a p-value of .183, and ‘Standards and Experiential’ (χ 2 = 5.093, df = 3, p>.01), with a p-value of .165.
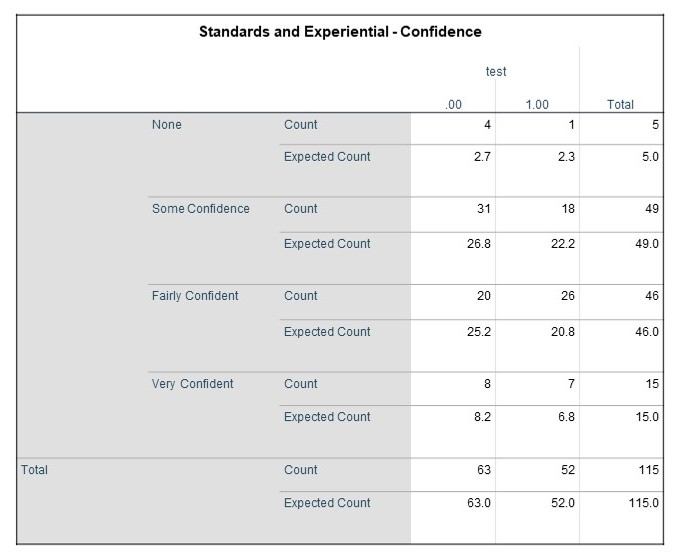
Table 7.6 – H4 Standards & Experiential – Confidence Cross Tabulation
While not originally part of the research design, the disparity in the expected outcome and the difference of results between the previously covered components of knowledge and confidence led the PI to wonder if there was something related to the type of experiential event that might be impacting the results. However, although a comparison between the two ‘Standards & Experiential’ schools showed some differences in the results, those differences also did not prove to be statistically significant (p>,01) based on the Chi Squared analysis. Therefore, the null hypothesis cannot be rejected in this case, the noted positive change in the data related to the experiential learning event is clearly an area that warrants further research and investigation with a larger and more complete sample population.
Research Outcome – Qualitative
In addition to the quantitative measures used in the research design of the S4 project covered above, there were qualitative components incorporated as well to help provide a complete and holistic assessment of the impact and efficacy of the S4 standards. The first qualitative component incorporated into the research were two open ended questions on the initial pre-test survey: “Q22. What do you see as the biggest threat or concern related to safety and security within your school?” And “Q23. If you could make one single improvement related to the safety and security of your school, what would it be?”
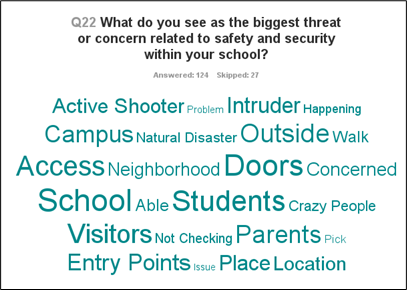
Figure 7.8 – Threat/Concern Word Cloud
As can be seen in the word cloud analysis for question 22 (figure 7.8), there are a number of key words that emerge (based on repetition of use) related to what the participants see as their greatest threat or concern within their respective school environment.
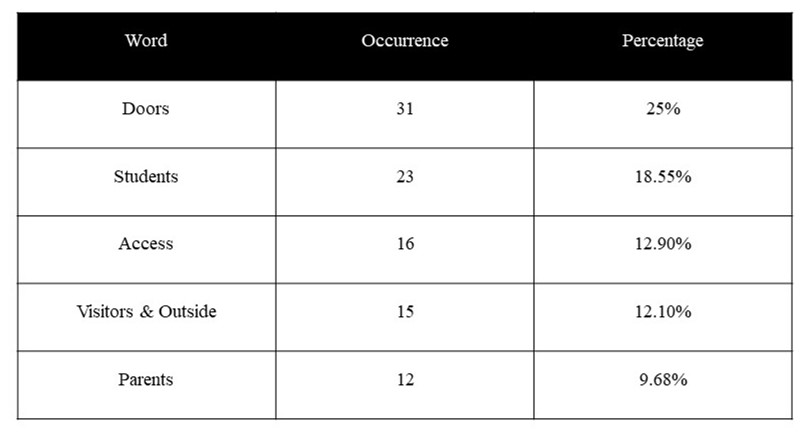
Table 7.7 – Threat/Concern Word Frequency
Based on this analysis, the top five words related to participants’ perception of their biggest threats/concerns is displayed above in table 7.7 above. As with all word cloud analysis, these results are based on overall repetition of use rather than perceived importance, ranking, or other factors that the participants may have considered in their responses. Although not in the top five, other notable threat/concern words mentioned include, Active Shooter, Intruder, Neighborhood, Entry Points, Crazy People, and Natural Disaster.
We find that there is a similar emergence in the word cloud for question 23 (figure 7.9) below, with many of the same high repetition key words and phrases, there are a number of key words however that emerge (based on repetition of use) related to what the participants would change or improve in their school environment as noted in table 4.8 below. Other notable improvement and change words seen are: Process, Phone, Bullet Proof Glass, PA/Intercom System, and Playground Procedures.
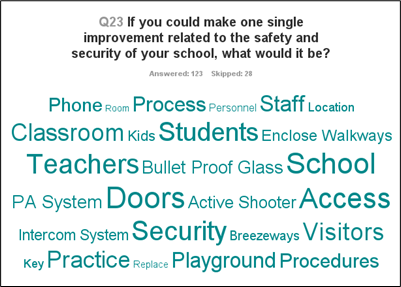
Figure 7.9 – Improvement Word Cloud
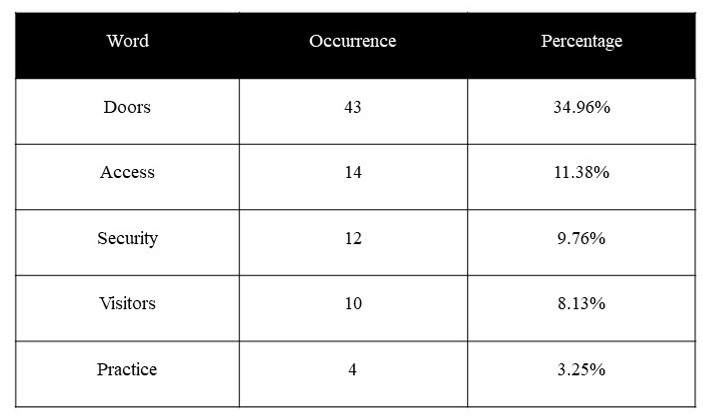
Table 7.8 – Improvement Word Frequency
The second area for qualitative analysis utilized the same data set of participant responses to the open ended survey questions. In this case, the advanced qualitative research software program, NVivo® was used in the examination and analysis of the 247 unique participant responses. In the process of coding these responses, fifteen distinct nodes or categories emerged related to school safety and security as listed in table 7.9 below. As a result of the coding of the 247 participant responses, 228 unique coded entries were recorded for evaluation and analysis within the 15 nodal categories.
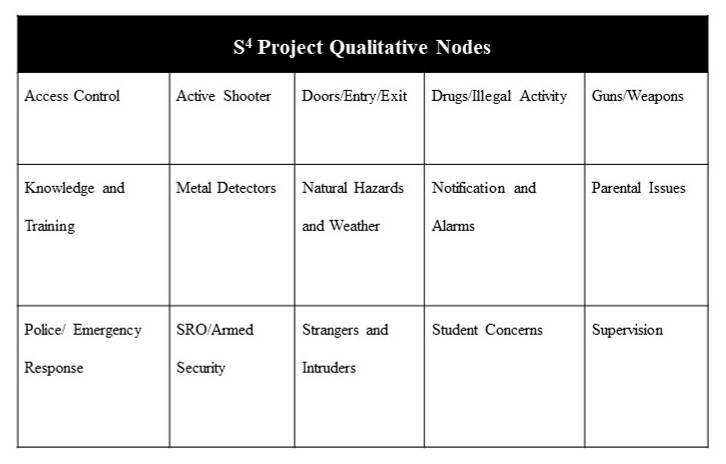
Table 7.9 – S4 Project Nodes
The 228 coded entries were then ordered by node and ranked based on their number of entries. As with the word clouds discussed previously, some distinct patterns emerged from the analysis and reflect the school safety and security concerns of the participants. Of the 15 original nodes that were identified during the coding process, the top seven all received ten or more entries and collectively accounted for just over 85% of the total entries. These nodal categories were tagged for further evaluation and are noted with their corresponding ranking in table 7.10 below.
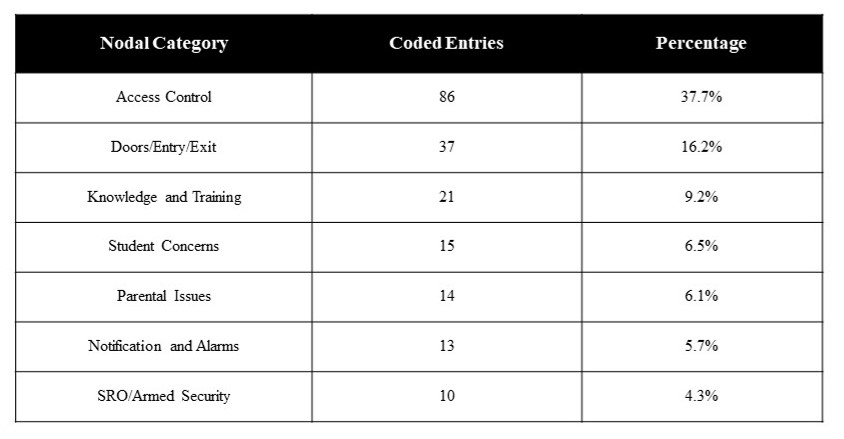
Table 7.10 – S4 Project Node Ranking
Access Control and Doors/Entry/Exit – Clearly these two top nodal categories represented the largest area of interest and concern for a majority of the S4 participants. As would be expected, these top two areas, while inherently related, are also distinctly different in terms of applicability and scope. Overall, the second category, Doors/Entry/Exit was primarily populated with comments related to the fact that in every one of the facilities, there were entry/exit doors that were supposed to be closed and secured but were routinely found to be left open and unsecured – either out of carelessness and oversight, or more commonly, as a matter of convenience for the students or in some cases, the faculty and staff themselves. There were also a fairly significant number of comments related to school floor plans and layout with concerns about the number of entry and exit points in the facilities. This was especially true considering that all of the schools involved in the S4 project have a multi-building facility layout.
The top ranked category of Access Control deals with many of the same issues outlined above. However, it is generally also broader in perspective and scope to include policy and procedure areas such as: visitor access and accountability procedures, parent and bus transportation drop off and pick-up procedures, parental and volunteer check-in and access procedures, and overall accountability and access procedures for students, faculty, and staff once they are on school property. There were also a fair number of comments related to specific technologies such as ‘buzz-in’ systems or ‘card swipe’ access systems as well as suggestions for changes to school construction and infrastructure.
Knowledge and Training – The third most ranked nodal category was related to knowledge and training and comments within this area tended to fall into one of three general themes:
- 1) Dissemination and communication of school safety and security information (particularly between the administration and the faculty and staff);
- 2) More training opportunities for faculty and staff in relation to school safety procedures, priorities, practices, and policies; and
- 3) More opportunity for practice, rehearsals, and drills across the spectrum of possible school emergency situations (such as those listed in the S4 standards).
As is evident from table 4.10 above, the last four remaining ranked nodal categories are very closely ranked with only a few comments or percentage points separating them, but obviously all are distinct areas of concern for the S4 participants.
Student Concerns – This was the fourth ranked area within the nodal categories and the comments within this area of concern appeared to be split almost evenly between student supervision issues (i.e. lack of student supervision) and with student compliance issues. Comments related to student concerns discussed the ability for students to essentially roam the halls freely in some schools as well as compliance issues such as student non-compliance with school safety and security procedures (complacency) or more intentional disruptive actions (subterfuge) on the part of students to short cut or sabotage school safety and security efforts.
Parental Issues – The fifth ranked area dealt with parental issues or concerns involving parents. Comments in this nodal category focused on two primary areas. The first was parental non-compliance with visitor check-in/out and drop off and pickup procedures. Almost equally noted were concerns of difficulty with custody situations involving students and non-custodial parents coming to the school as well as potentially belligerent or abusive parents both in the home environment, but also potentially in the school setting itself and the need for mitigating strategies.
Notification and Alarm Systems – is the sixth ranked nodal category. Comments in this area almost exclusively were concerned with the complete lack of a reliable notification or public address system in some schools (one relied exclusively on their normal bell system) or doubts about the effectiveness of existing systems in others. Additionally, there were also a few comments regarding the lack of land line phone communications in some classrooms and work areas in some of the S4 participant schools.
School Resource Officers (SRO) and/or Armed Security Officers – This final ranked nodal category gathered comments that were primarily related to the need for a SRO/Armed Security Officer for the schools that did not already have one or for an increase in the number or distribution of those assets for schools that already had them assigned. Interestingly, a somewhat related discussion to this area, were comments in the next non-ranked category dealing with guns/weapons and focused on a perceived need by some faculty and staff for the ability to have designated (non-security) personnel with weapons training and access to firearms at school or to alternately allow concealed carry weapon permit holders to have access to their own weapons while on school property. Of note, this was an issue that seemed to come up at least once in every S4 session or assessment and at every participating school.
Intangibles and Final Impressions – While the previously discussed quantitative data showed the impact on the S4 standards project from an objective perspective in terms of measurable outcomes, in many ways it was the emotional responses and impressions of the participants that provided some of the most insightful perspective in regards to project’s impact. The final open-ended question asked in the post-test survey allowed for some of these free form responses as the participants were asked “If you would like, please provide any comments as to your overall impression of the S4 School Safety and Security Standards Project?” There were only twenty-two of these type responses provided from the participants, but they proved useful in looking at the final thoughts and hopefully the longer term impacts of the project. A sentiment analysis of these results was conducted using NVivo ® and the results are presented below in figure 7.10.
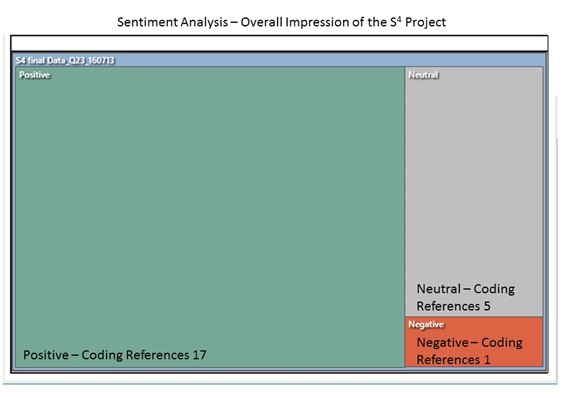
Figure 7.10 – Sentiment Analysis S4 Project Impressions
Overall, the sentiment of the majority of participants (74%) was recorded as either moderately positive or very positive. Most of these comments tended to be related to the participant’s experience with the project and were mostly recorded by participants who were involved with one of the experiential learning opportunities. As one participant reflected “Actually experiencing an intruder drill without students present in the building was illuminating and highly impacting on an emotional level as well as intellectually in what the process of safety would entail. I appreciate this experience.” (S4 Post-Test Survey Response) Additionally, another participant remarked that they felt “fortunate to have an opportunity to be a participant in this type of training. I feel more prepared and confident in the event I have to deal with a situation of this type in the future.” S4 Post-Test Survey Response) The neutral comments tended to affirm support for the project or suggest that it should be included in future school training plans.
The single comment that was noted as moderately negative due to the lingering uncertainty that the participant felt when they stated that “The drill really impacted our school. We talk about the results almost every day. The uneasiness is still there for me and we still have some holes in our process. I am definitely going to make some physical plant changes to my room this summer to make it easier to protect my students and myself. Thanks.” (S4 Post-Test Survey Response) Although this response was recorded as negative as part of the sentiment analysis, it clearly also helps to show the kind of impact that an experiential learning event can have.1
The School Safety and Security Standards (S4) Assessment
The final evaluative component of the S4 research project was the actual School Safety and Security Assessment utilizing the previously discussed S4 standards. There were two components to this process, with the participants being encouraged to use the standards to conduct a self-assessment of their classrooms, work areas, and schools as a method to assist in making their facilities safer and more secure and also to assist in building knowledge and confidence of the participants.
The second assessment component was the use of the standards to conduct an external evaluation of each school using a team of trained evaluators from outside of the school faculty and staff. The results of these evaluations were collected and analyzed to determine overall trends and areas of improvement and also to provide feedback to each schools’ administration regarding their school safety and security posture.
1 This participant’s classroom was breached by the active shooter role player during the full profile exercise and her and her student role players were assessed as casualties as a result.
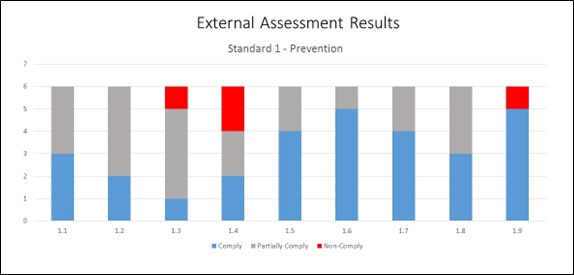
Figure 7.11 – External Assessment Results – Standard 1
As can be seen above in Figure 7.11, the results for Standard 1 – Prevention are largely positive with the majority of schools being rated as fully or partially complying with most of these standards. The majority of items noted for improvement under this standard are related to policy improvements and the formalization of procedural actions that largely do occur but are not recorded for continuity. The areas of non-compliance tended to center on schools not having done formal assessments or audits as suggested by the standards.
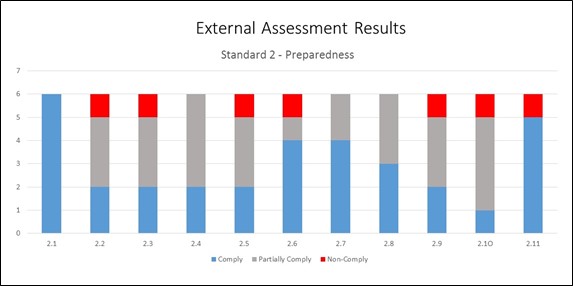
Figure 7.12 – External Assessment Results – Standard 2
As with standard one, the results for Standard 2 – Preparedness (Figure 7.12) are also largely positive with the majority of schools again being rated as fully or partially complying with most of these standards, however in this area there does seem to be more areas of non-compliance noted. In both the cases of items needing improvement and areas where non-compliance was noted, most of the issues tended to be related to either information not being properly posted or alternately being posted but being out of date or incomplete. The same observations were noted regarding equipment and emergency supplies in some cases.
The next area of evaluation consisted of standard 3 – Intervention, which is depicted below in Figure 4.11, and appears to be the strongest area for schools in terms of compliance and was noted by the evaluators as an area were schools seemed to have the most comfort and expertise in applying the S4 standards.
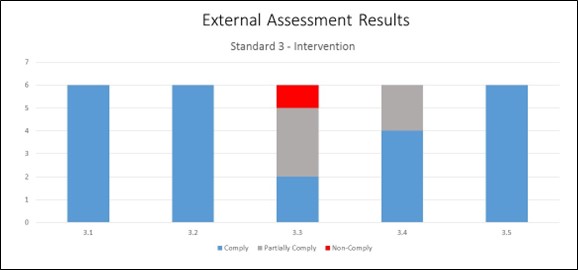
Figure 7.13 – External Assessment Results – Standard 3
This result was expected as many of these processes are used by school officials on a regular basis in day to day interactions with students in addition to emergency and crisis situations. The areas noted for partial and non-compliance were largely related to the lack of formal recording and reporting in regards to discipline auditing.
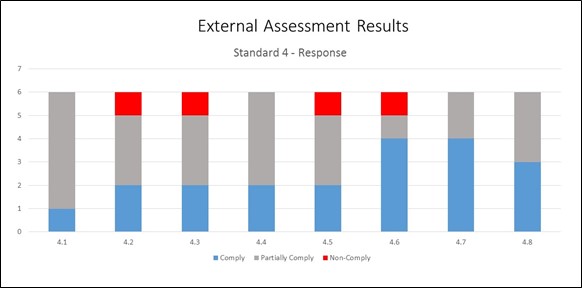
Figure 7.14 – External Assessment Results – Standard 4
As can be observed in Figure 7.4 above, Standard 4 – Response, also seemed to be largely a good news story in terms of the overall school compliance with the majority of schools registering either full or partial compliance with the standards. Most of the improvement areas noted in partial compliance recorded that adequate policies and procedures were in place, but in many cases had not been properly tested or exercised. In the areas of non-compliance, the schools tended not to have policies and protocols in place related areas that, while unlikely in terms of frequency, had potentially large impact in terms of consequences. Many of these areas had been noted in each of the schools own self assessments and were in the process of being rectified or updated to comply with the S4 standards.
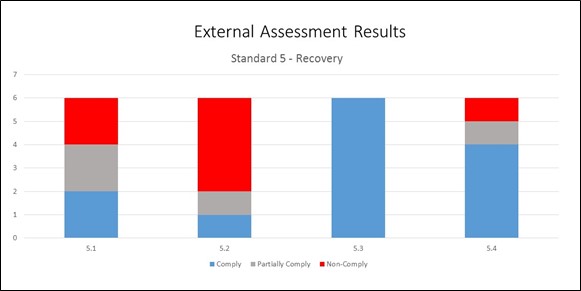
Figure 7.15 – External Assessment Results – Standard 5
Subsequently, Standard 5 – Recovery (Figure 7.15) was clearly the weakest area in terms of overall compliance across all of the schools evaluated. Again this result was not unexpected in light of the fact that luckily most schools and school systems are normally not required to implement these type of plans and measures. In most cases of non-compliance noted, the school had no plan or consideration for what would occur if their facility (in whole or in part) were compromised or destroyed. This even included continuity of operations procedures for utility disruption. However, one observation noted that in many cases the Recovery function tends to reside at the school system administration level rather than the individual school. The key exception under this standard was recovery related to “policies, plans, and/or procedures for emotional and physical health recovery needs for students and staff after an incident.” (S4 Final Survey). Generally, this is an area which falls within the purview of the school guidance counselor and is usually well developed in terms of dealing with events and situations impacting individuals as well as the school community overall.
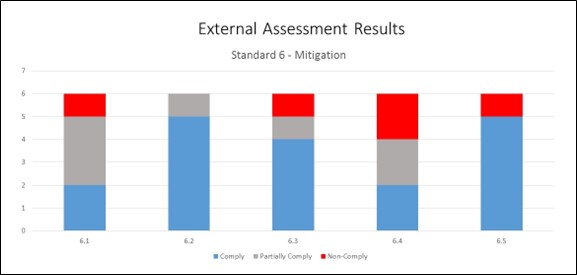
Figure 7.16 – External Assessment Results – Standard 6
The final evaluation area was Standard 6 – Mitigation, and as with Prevention and Preparedness, it was noted as an area with significant compliance (both full and partial), but also an area of concern in regards to certain non-compliance issues. The importance in this observation is that mitigation, by its very nature seeks to prevent or to lessen the degree of harm or impact in the event that an incident occurs. As with the recovery standard, it appeared that many schools simply did not have experience in this area because they have not had to deal with the type of situation or incidents outlined in the S4 standards. Most areas for improvement dealt with the need for threat and hazard analysis to allow for better planning and assessment and also pre-incident collaboration with responding agencies and stakeholders.

